Session Gallery
ESR1 binding around classical target genes
ESR1 binding at genes involved in epithelial-to-mesenchymal transition (EMT) during initial tumor invasion
PGR and AR binding in enhancer regions of the KLK3 and RANKL genes
STAT3 binding and CAGE data reflect the activity of an enhancer of the AIM2 gene
ESR1 Binding in Promoter regions of classical target genes
GREB1 promoter region in the hg19 Assembly
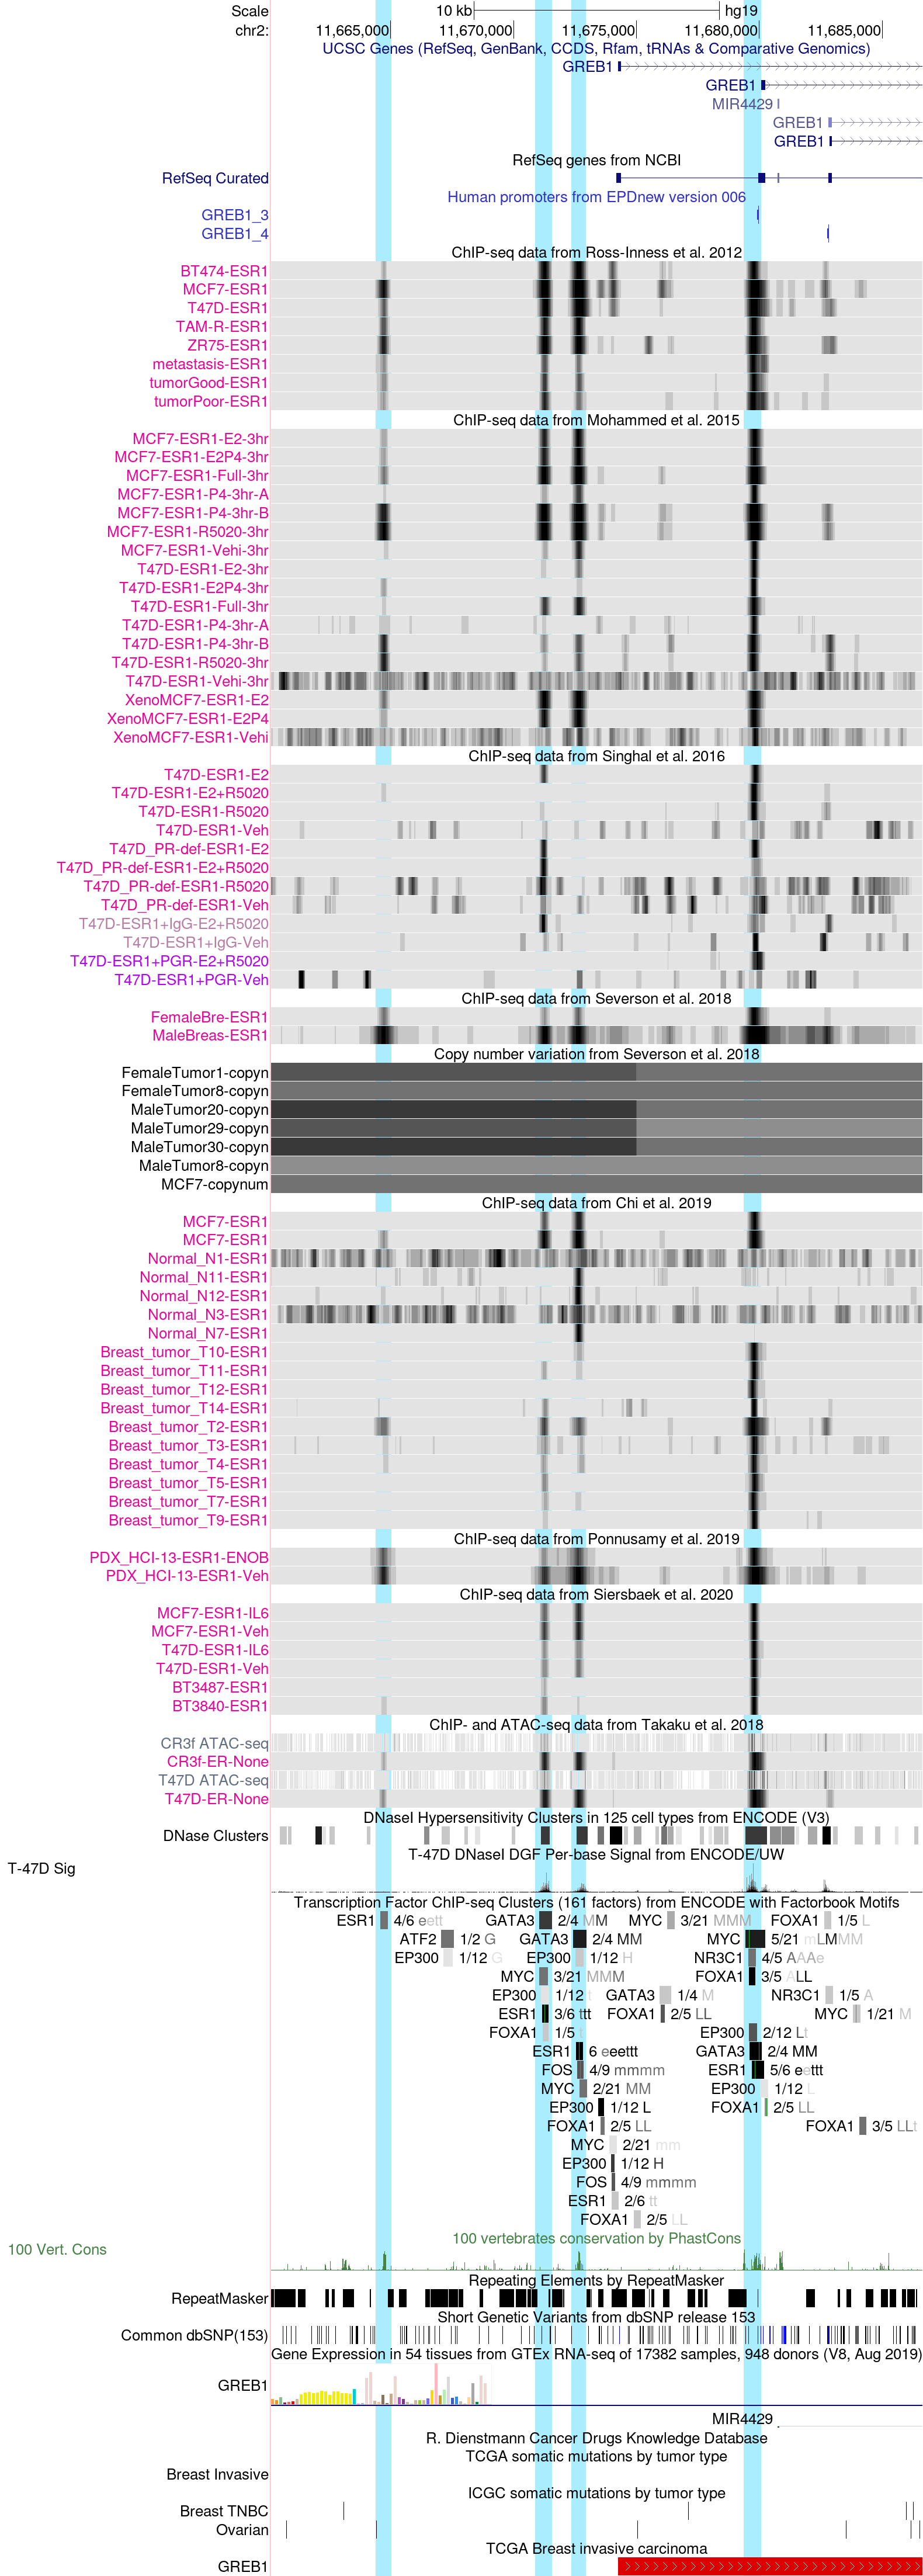
The above session helps illustrate the display of the upstream region of the GREB1 gene, a known target of estrogen receptor (ER, also denoted ESR1 according to the HGNC gene symbols convention). The genomic region is displayed through a "customized view" focusing on ESR1 binding sites. ChIP-seq experiments from various sources are shown (Ross-Innes et al., Mohammed et al., Singhal et al., Severson et al., Chi et al., Ponnusamy et al., Sierbaek et al., and Takaku et al.), covering various types of cellular sources: cancer cell lines, surgically removed tumors and metastases, normal breast epithelial cells and patient-derived xenografts (PDXs). The tracks are shown in "dense" display mode.
With these display settings, signal intensity is portrayed on a grey scale: the darker, the more intense. By right-clicking on the left sidebar (in grey) of a given track set, one can configure the display of the data tracks.
The browser window shows four regions bound by ESR1, which will be referred to as regions 1 to 4 from left to right. The rightmost region 4 corresponds to a promoter included in EPD, which is well supported by CAGE tags. This region is bound by ESR1 in most samples but curiously not in normal breast epithelial cells.
The browser screenshot further includes tracks reflecting chromatin accessibility: DNase 1 hypersensitivity sensitive regions (DNAse Clusters") and single base resolution digital genomic footprints (DGF) for the T47D cell line (T-47D Sig). Both tracks are from the ENCODE consortium. The regions track is merged over many cell types analyzed whereas footprint track is from T47D cells only, thus reflecting the specific chromatin state of this cell line.
Just below the T-47D Sig track appears the composite ENCODE ChIP-seq clusterstrack. The grey bars represent merged binding regions for the same TF from 91 cell types. The thin green vertical bars indicate computationally predicted binding sites, using the position specific scoring matrices from Factorbook (PMC3531197). The complete track provides data for 161 different TFS, which can be individually selected for display. The following breast cancer-relevant TFs were selected: ATF(1,2,3), ESR1, EP300, FOXA1, FOS, GATA3, MYC and NR3C1 (GR).
Not surprisingly, the four ESR1 binding regions found in tumor tissue are confirmed by the ENCODE data. All four regions contain ESR1 motifs suggesting that ESR1 binds directly to the DNA of these regions rather by piggy-backing on another TF. Note however that the weakly bound region 1 is the only one, which is not simultaneously bound by at least one of the other TFs.
The track just below the ENCODE ChIP-seq clusters track indicates cross-species sequence conservation. We note that region 1, though largely inaccessible according to chromatin assays and not bound by ESR1 in normal breast cells, is nevertheless highly conserved. This suggests that this region has a vital function in ESR1-regulated GREB1 expression in normal tissues though perhaps not in breast epithelial cells. Conversely, the lack of cross-species conservation of regions 2, suggests that this region has no function in normal tissue and may be causally involved in tumorigenesis.
PGR promoter region in the hg19 Assembly
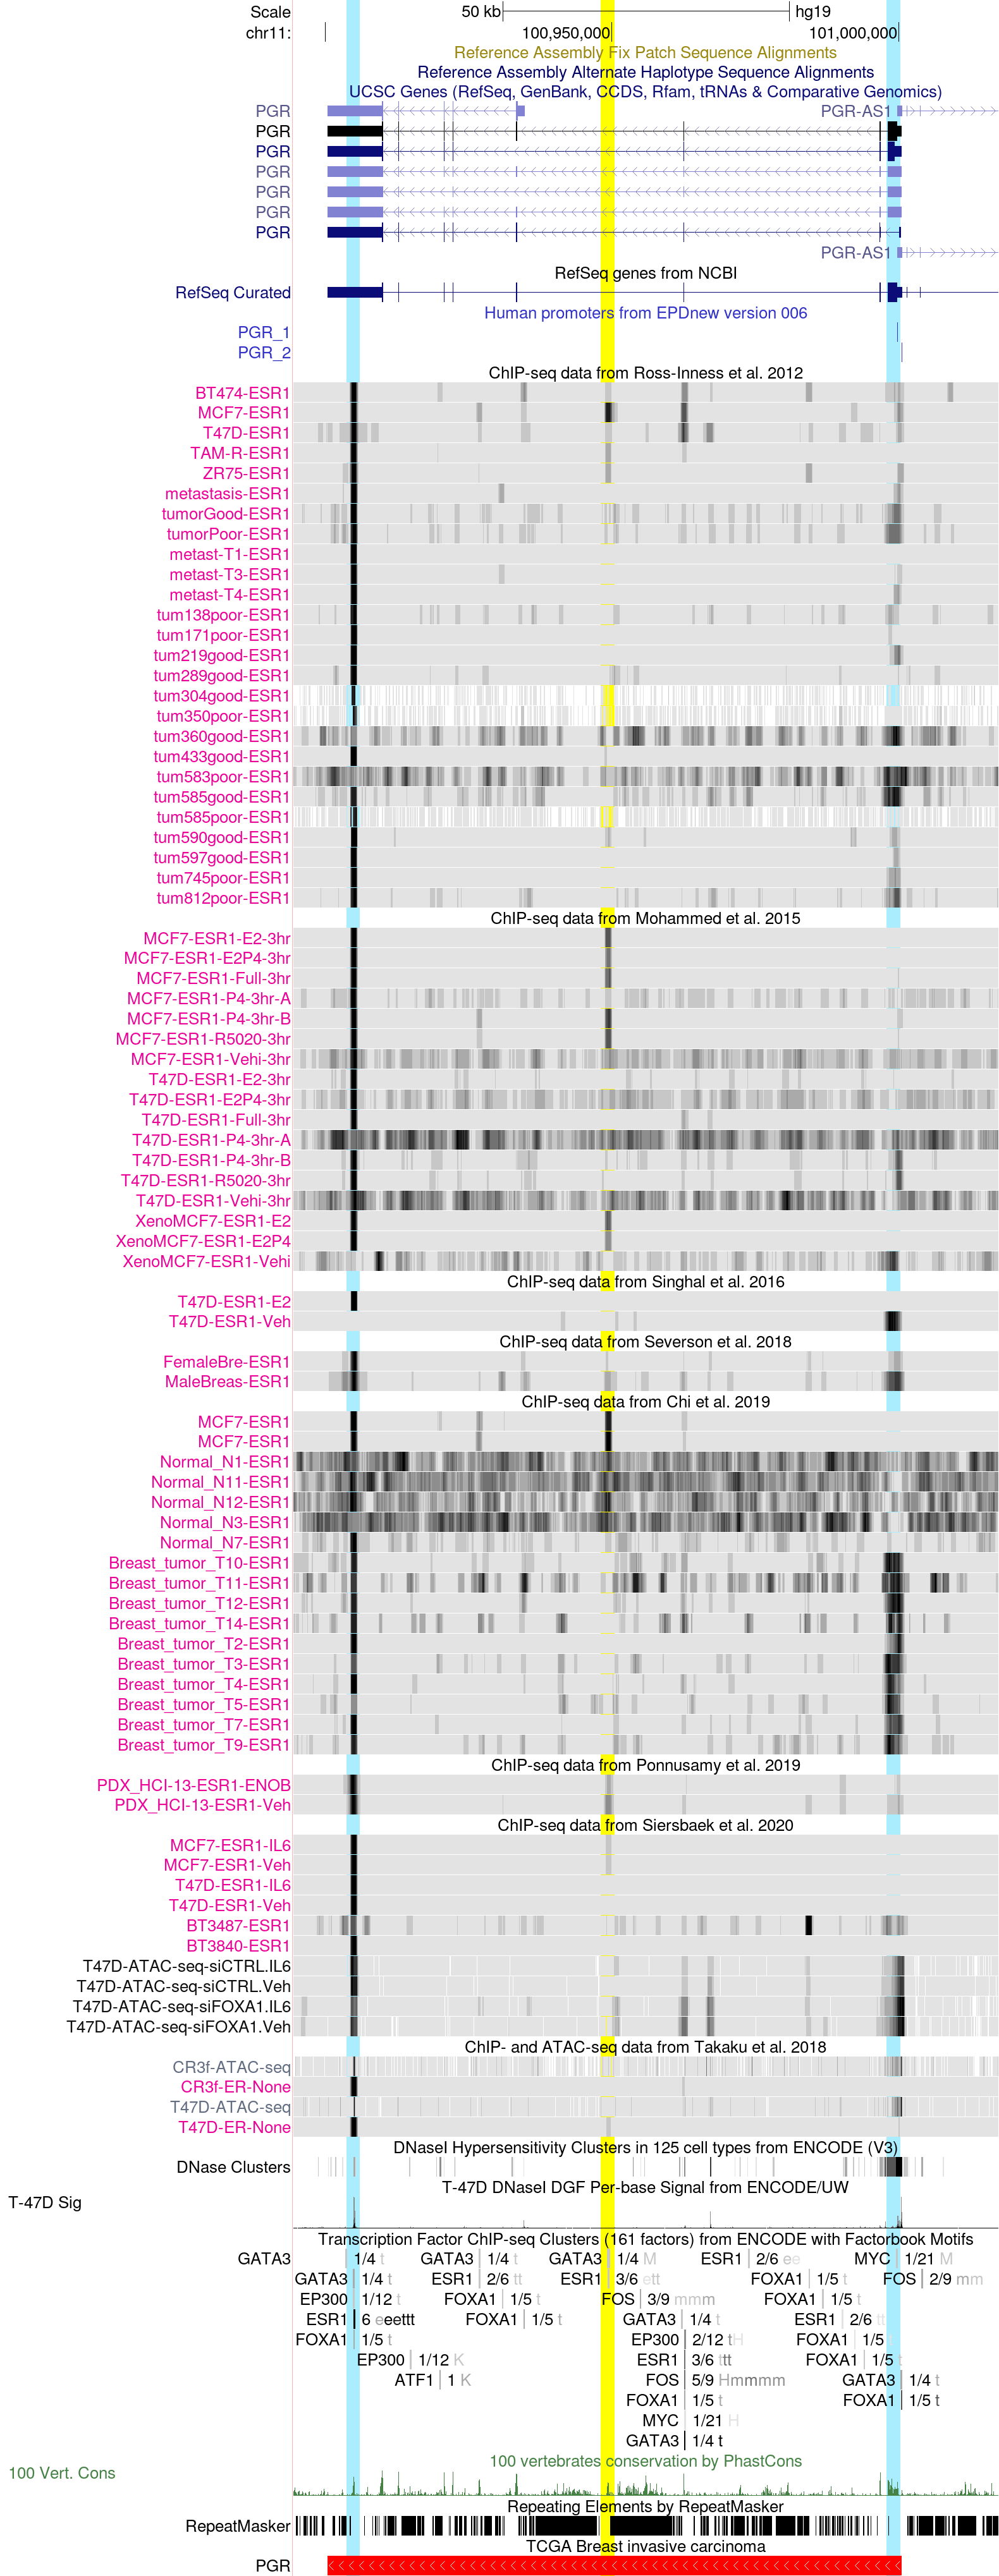
This session displays the genomic region of progesterone receptor (PGR), a hormone receptor that plays an important role in breast development and functions (PMID: 32508307). PGR is a known target gene of estrogen receptor (ER), as its expression is induced by estradiol through the activation of the estrogen receptor (PMID: 2477493, PMID: 7997237).
By focusing on the PGR gene locus we note three regions of interest with peaks that indicate ER binding across various datasets: the first one on the left side within the last exon of PGR, the second in the center of an intronic region, and the last one in the rightmost side in the proximity of the PGR promoter. The first region displays the higher degree of consistency of the ER binding across datasets, with a clear signal present in breast cancer cell lines, clinical specimens, and xenografts models. The region in the center appears to not be bound by ER in most cell lines and clinical specimens, but display consistent signal only in MCF7, indicating a possible peculiar ER cistrome in this cell line. Of note, a weak signal in the central region can be noted in two clinical specimens of female and male breast cancer respectively (Severson et al. dataset), as well as in a patient-derived xenograft model (Ponnusamy et al. dataset), implying that the same peculiar cistrome can be observed in a subset of BC patients. Similarly, MCF7 appears to be devoid of ER binding in the third region of interest at the PGR promoter, as opposed to other breast tumor clinical specimens across different datasets (Ross-Innes et al., Severson et al., and Chi et al.).
Importantly, in the normal breast samples from Chi et al., all three regions of interest appear to be void of ER, suggesting weaker ER binding in normal breast tissue as compared to tumors. To reject the hypothesis that this might be due to low coverage, we note that most of the samples display clear signal at another ER target gene, GREB1 (see GREB1 session above). Additionally, by inspecting the quality control reports of the samples (they can be viewed in the track configuration page or here), we can observe that the sequenced DNA library is highly enriched for ER motifs.
To examine whether other transcription factors have been detected by ChIP-seq experiments in these regions, we can look at the ENCODE transcription factor clusters track set. In the first region, we can observe that both the pioneer factors GATA3 and FOXA1 are found together with ER. An ER consensus motif is also present at this region, suggesting direct binding. ER with its consensus motif, as well as GATA3, are also found at the central region of interest. Instead, at the PGR promoter, only GATA3 and FOXA1 are detected in the ENCODE collection, indicating that ER might be recruited by the two pioneering factors.
By looking at the ATAC-seq data of Siersbaek et al., as well as the ENCODE T-47D DNAse I Sig track, it appears that the most accessible and potentially active regions are the first and the third, while the central intronic region display a more close chromatin conformation, suggesting a less likely regulatory activity in these datasets.
MYC promoter and enhacer regions in the hg19 Assembly
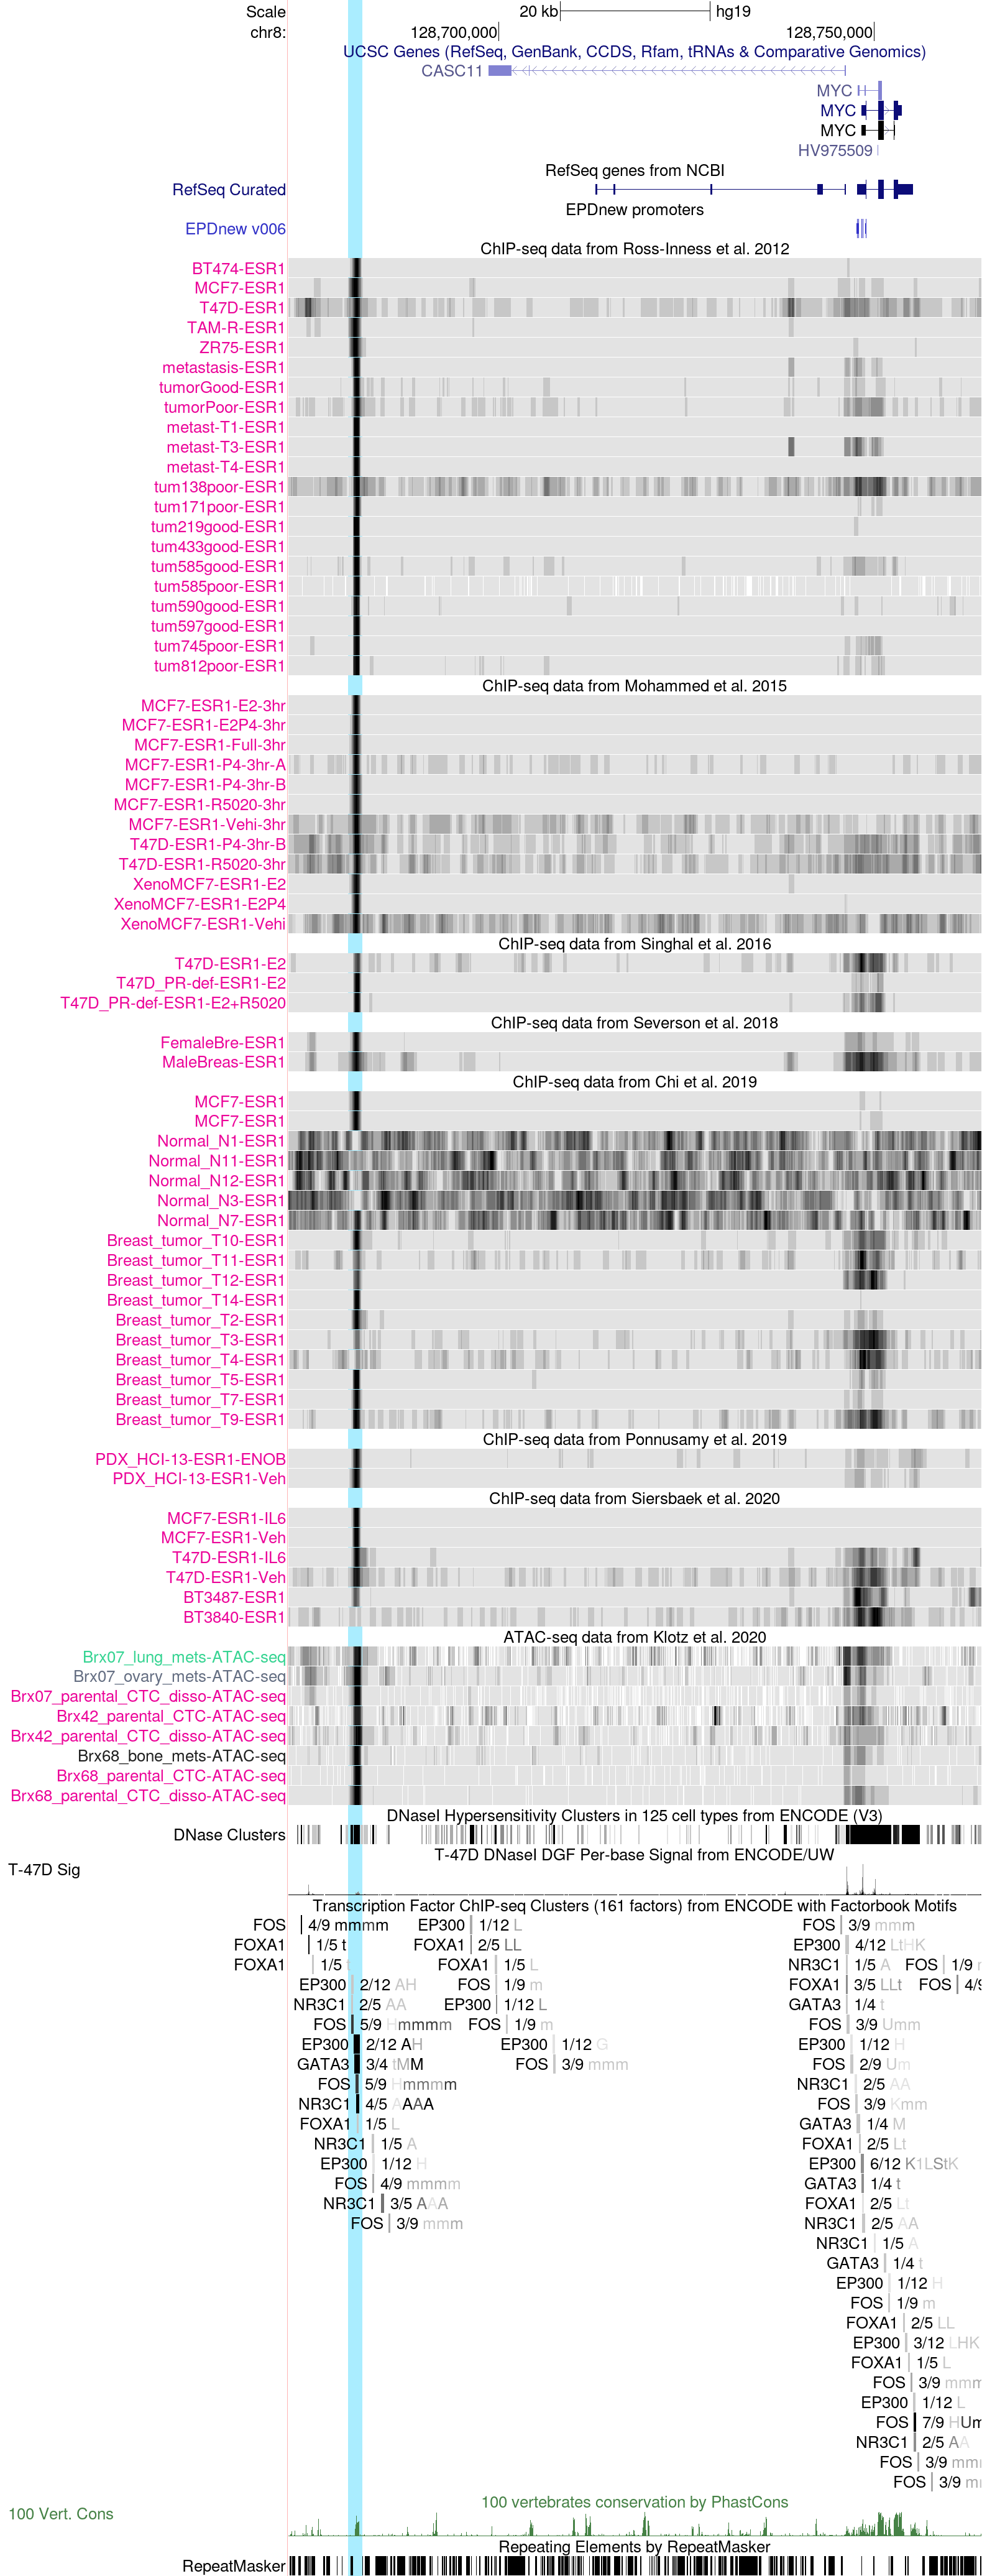
The above session helps illustrate ESR1 binding in both the promoter and enhancer regions of the proto-oncogene MYC. MYC is a transcription factor that promotes cell growth and proliferation, and regulates cell metabolism. Its overexpression also causes chromosomal instability.
MYC is overexpressed in the basal-like subtype and may serve as a target for this aggressive subtype of breast cancer. Tumor suppressor BRCA1 inhibits MYC's transcriptional and transforming activity. Loss of BRCA1 with MYC overexpression leads to the development of breast cancer - especially, basal-like breast cancer.
Although c-MYC is a well-known estrogen-induced gene, its promoter has no estrogen-response element, several genome-wide studies suggested that distant elements may mediate estrogen induction of gene expression.
In particular, a study in 2011 (PMC3165912) has revealed a novel pathway of estrogen regulation of gene expression by cooperation between ESR1 and the activator protein 1 (AP-1) at a distal 67-kb enhancer region. According to this study, The c-MYC proximal promoter is not responsive to estrogen. Because c-MYC proximal promoter is not responsive to estrogen, they examined c-MYC gene structure in this global genomic context and found a distal ER-binding region (~1.2 kb in length) located at about 67 kb upstream of the transcriptional start site of the c-MYC gene. This region has been identified in two other independent genome-wide studies (PMID:17013392, PMID:17542648) and therefore may contain a functional ER-binding site. They demonstrated that a half-ERE and an AP-1 site are both critical for estrogen induction of c-MYC expression.
In the above session, highlighted in light blue, we can see the distal ER-binding region located at about 67 kb upstream of the transcriptional start site of c-MYC. The binding of ESR1 is confirmed by several experiments targeted at ESR1 binding in ER-positive breast cancer. It is cancer-specific but not present in normal mammary epithelial cells (Chi et al.).
Interestingly (please have a look here), several ChIP-seq assays (Mohammed et al., and Severson et al.) also show clear PGR and AR binding signals in this distal region in cell lines (MCF7, and to a lesser extent n T47D) MCF7-derived xenografts, and both female and male breast tumors . Similarly, a female breast cancer xenograft from the Ponnusamy et al. track, shows a strong AR binding signal. Besides, STAT3 and FOXA1 also seem to be bound at this MYC enhancer in MCF7 cell lines (Siersbaek et al., and Ross-Innes et al. for FOXA1) and tumors (Severson et al.) in a treatment-independent manner, thereby supporting the functional relevance of this enhancer element.
The presence of a strong FOXA1 binding indicate that the cancer-specific hormone receptor binding is most likely mediated by FOXA1 alongside other recruiters.
By zooming in to this enhancer peak region (here) and looking at both the ENCODE ChIP-seq and conservation tracks, we can appreciate that it is a conserved region and a binding region (with an identified motif) of several TFs such as FOS, a protein that belongs to the AP-1 protein family, FOXA1, GATA3 and NR3C1 (GR), therby confirming the above observation. Besides, according to both the ENCODE T-47D DNaseI Sig and the Klotz et al. ATAC-seq data tracks, this region is largely accessible in tumors, cell lines and circulating tumor cells.
ESR1 binding at two genes strongly involved in epithelial-to-mesenchymal transition (EMT) during the initial stages of tumor invasion
CDH1 (E-Cadherin) promoter region in the hg19 Assembly
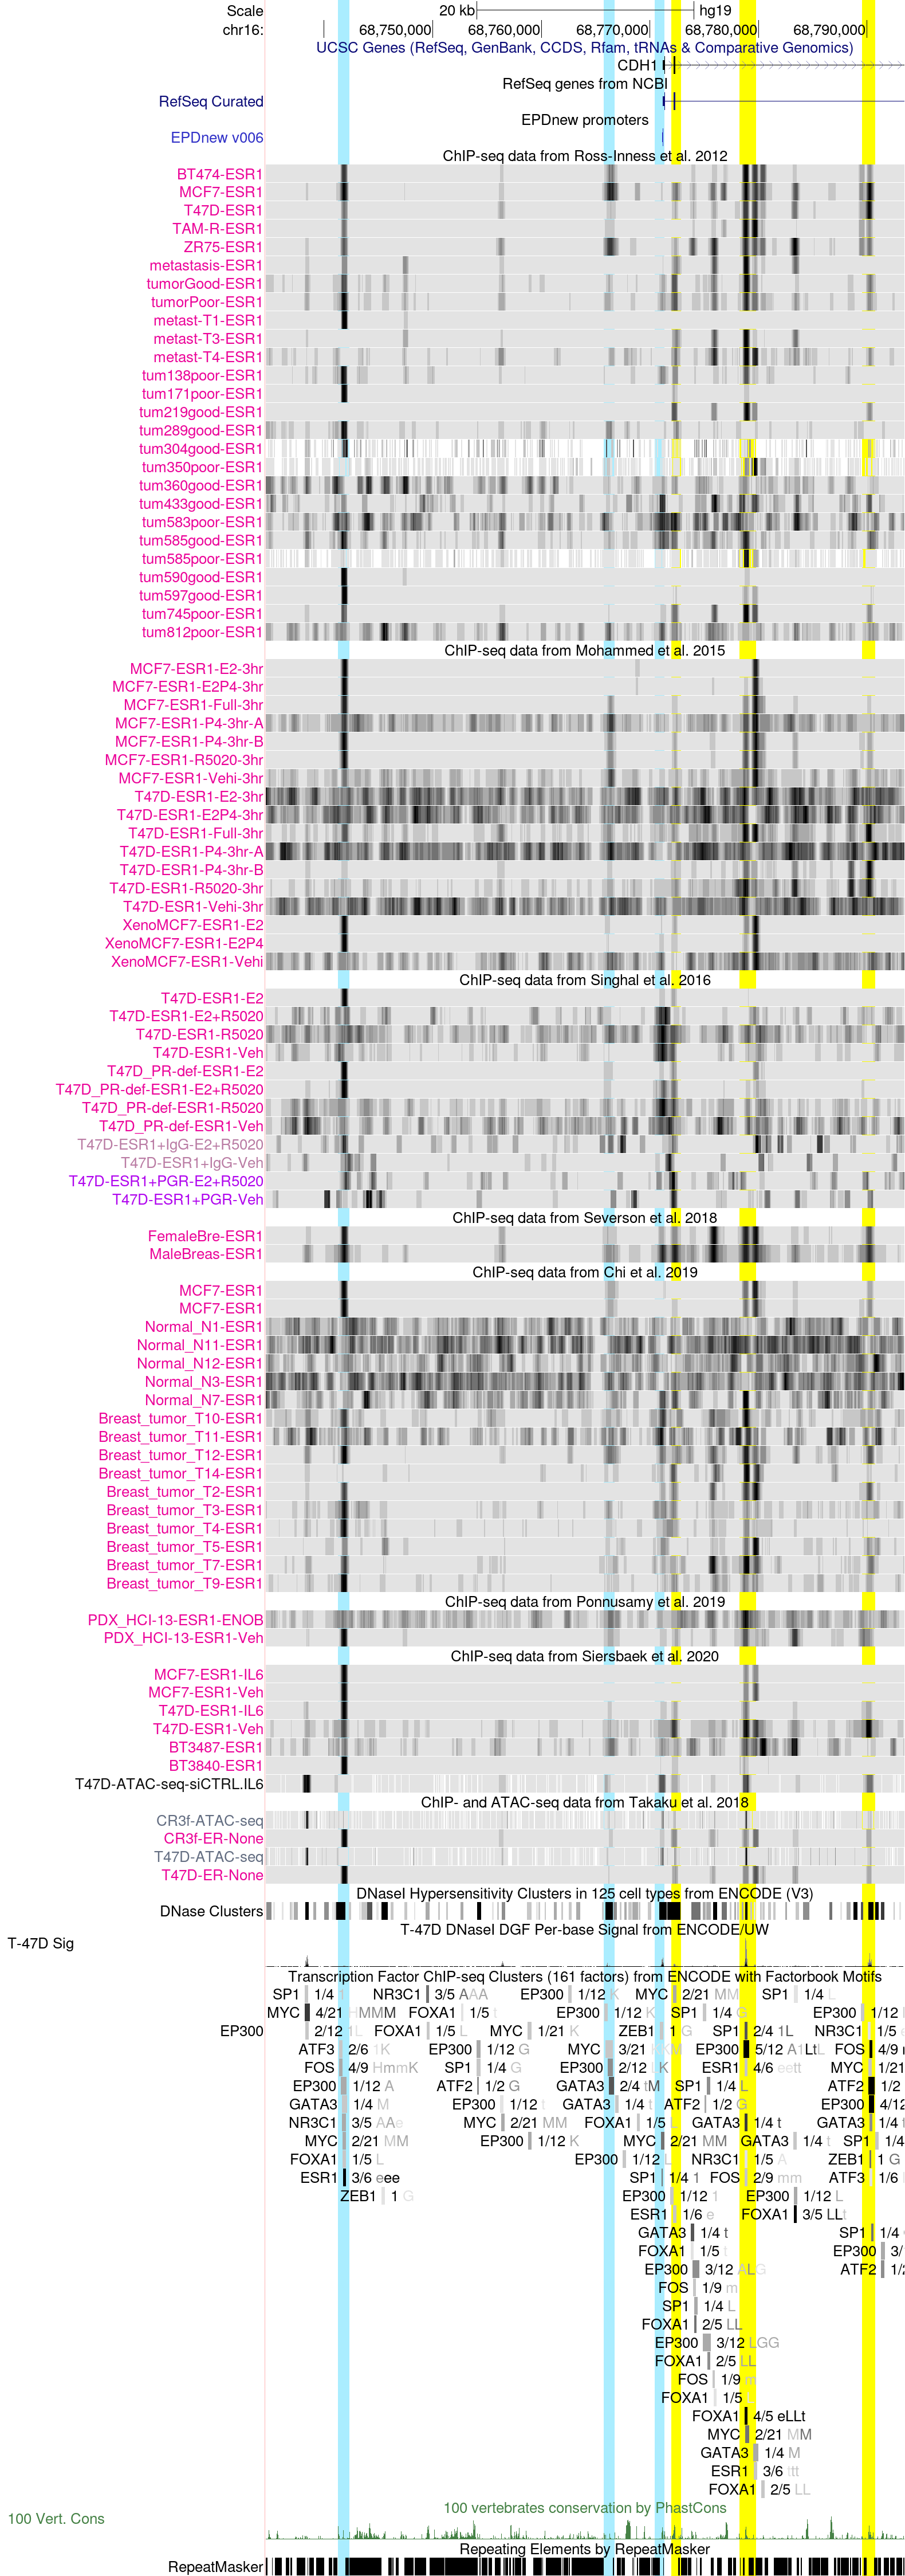
Estrogen receptor α (ERα or ESR1) and E-cadherin (CDH1) are primary markers of luminal epithelial breast cancer cells with E-cadherin being a main caretaker of the epithelial phenotype. E-cadherin repression is needed for cancer cells to acquire motile and invasive properties, and it is known that in ER-positive breast cancer cells, estrogen down-regulate E-cadherin gene transcription.
It has been shown (PMC2671327) that ERα is bound to the E-cadherin promoter in both the presence and the complete absence of estrogen, suggesting a bivalent role for ERα in E-cadherin transcription. These data show that activation by unliganded ERα and repression by estrogen-activated ERα require direct binding to a half-estrogen response element within the E-cadherin promoter (at position -164/-160) and exchange from associated coactivators to corepressors. These data suggest that ERα plays the dual role of ligand-independent activator and ligand-dependent repressor of E-cadherin in breast cancer cells.
The above session shows ESR1 binding at the E-cadherin core promoter and proximal upstream regions as well as the gene body. The promoter and upstream regions are highlighted in light-blue, whereas the regions within the gene body in yellow.
At the core promoter (here), there is little evidence of ESR1 binding according to our data (with the exception of male breas tumors in Severson et al.). As expected, this region overlaps with an open chromatin region shown in the ENCODE T47-D DNaseI Sig track , and, interestingly, reveals SP1, MYC, and ZEB1 binding according to the ENCODE ChIP-seq clusters track. Estrogen responsive elements have been often defined in the proximal promoter region of genes and in conjunction with other regulatory sequences (SP1, AP1). Besides, the ZEB1 zinc finger transcription factor is prime element of a network of transcription factors controlling epithelial-to-mesenchymal transition (EMT). For example, ZEB1 transcriptionally regulates the CDH1 gene, by interacting with its promoters by associating CtBP transcriptional corepressors followed by the SWI/SNF chromatin-remodeling protein BRG1 recruitment, which further represses CDH1 gene expression and induces the progression of EMT (PIMD:16804902).
Cell line specific ESR1 binding is instead observed within the gene first exon (highlighted in yellow here). This region is conserved too, and there is evidence for direct ESR1 binding.
Upstream of the core promoter region, we can observe two interesting putative ESR1 regulatory regions (highlighted in light blue here).
ESR1 binding at the region closer to the promoter is weak and not consistent across datasets: it is detected by Ross-Innes et al. ChIP-seq in a few cells lines, MCF7, ZR75, and BT474 but not in breast tumors, xenografts or PDXs.
Instead, there is stronger evidence for cancer-specific ER-binding at the left-most region (about 30 kb upstream of the gene) in MCF7 cell lines and xenografts (Ross-Innes et al. and Mohammed et al.), and in both tumor samples and PDXs (Ross-Innes et al., Severson et al. and Chi et al., and Ponnusamy et al.). This region is partially conserved across vertebrates according to the PhastCons conservation track, and bound by ESR1 in a epithelial cell line derived from an endometrium adenocarcinoma (ENCODE ChIP-seq clusters track), pinpointing a possible regulatory function of ESR1 in endometrial adenocarcinoma.
We can finally observe quite strong cancer-specific ESR1 binding, which is estrogen treatment-independent, at several sites in the CDH1 gene body, notably at the first exon (as discussed earlier) and within the second intronic region (see peaks highlighted in yellow here). The exon peak and the two of the three peaks within the second intron overlap with open chromatin regions as well as binding of other co-factors (GATA3, FOXA1, SP1, AP1). The two right-most intronic binding regions seem to be cell-line specific (although not consistently across all datasets), with the exception of male breast tumors (Severson et al.), whereas the left-most region within the second intron is more breast tumor and metastasis-specific and only partially cell line-specific.
Overall, the data tracks for E-cadherin indicate a wide range of mechanims contributing to the regulation of E-cadherin transcription in cancer, whihc might be context dependent and tissue-specific.
CTSD genomic region in the hg19 Assembly
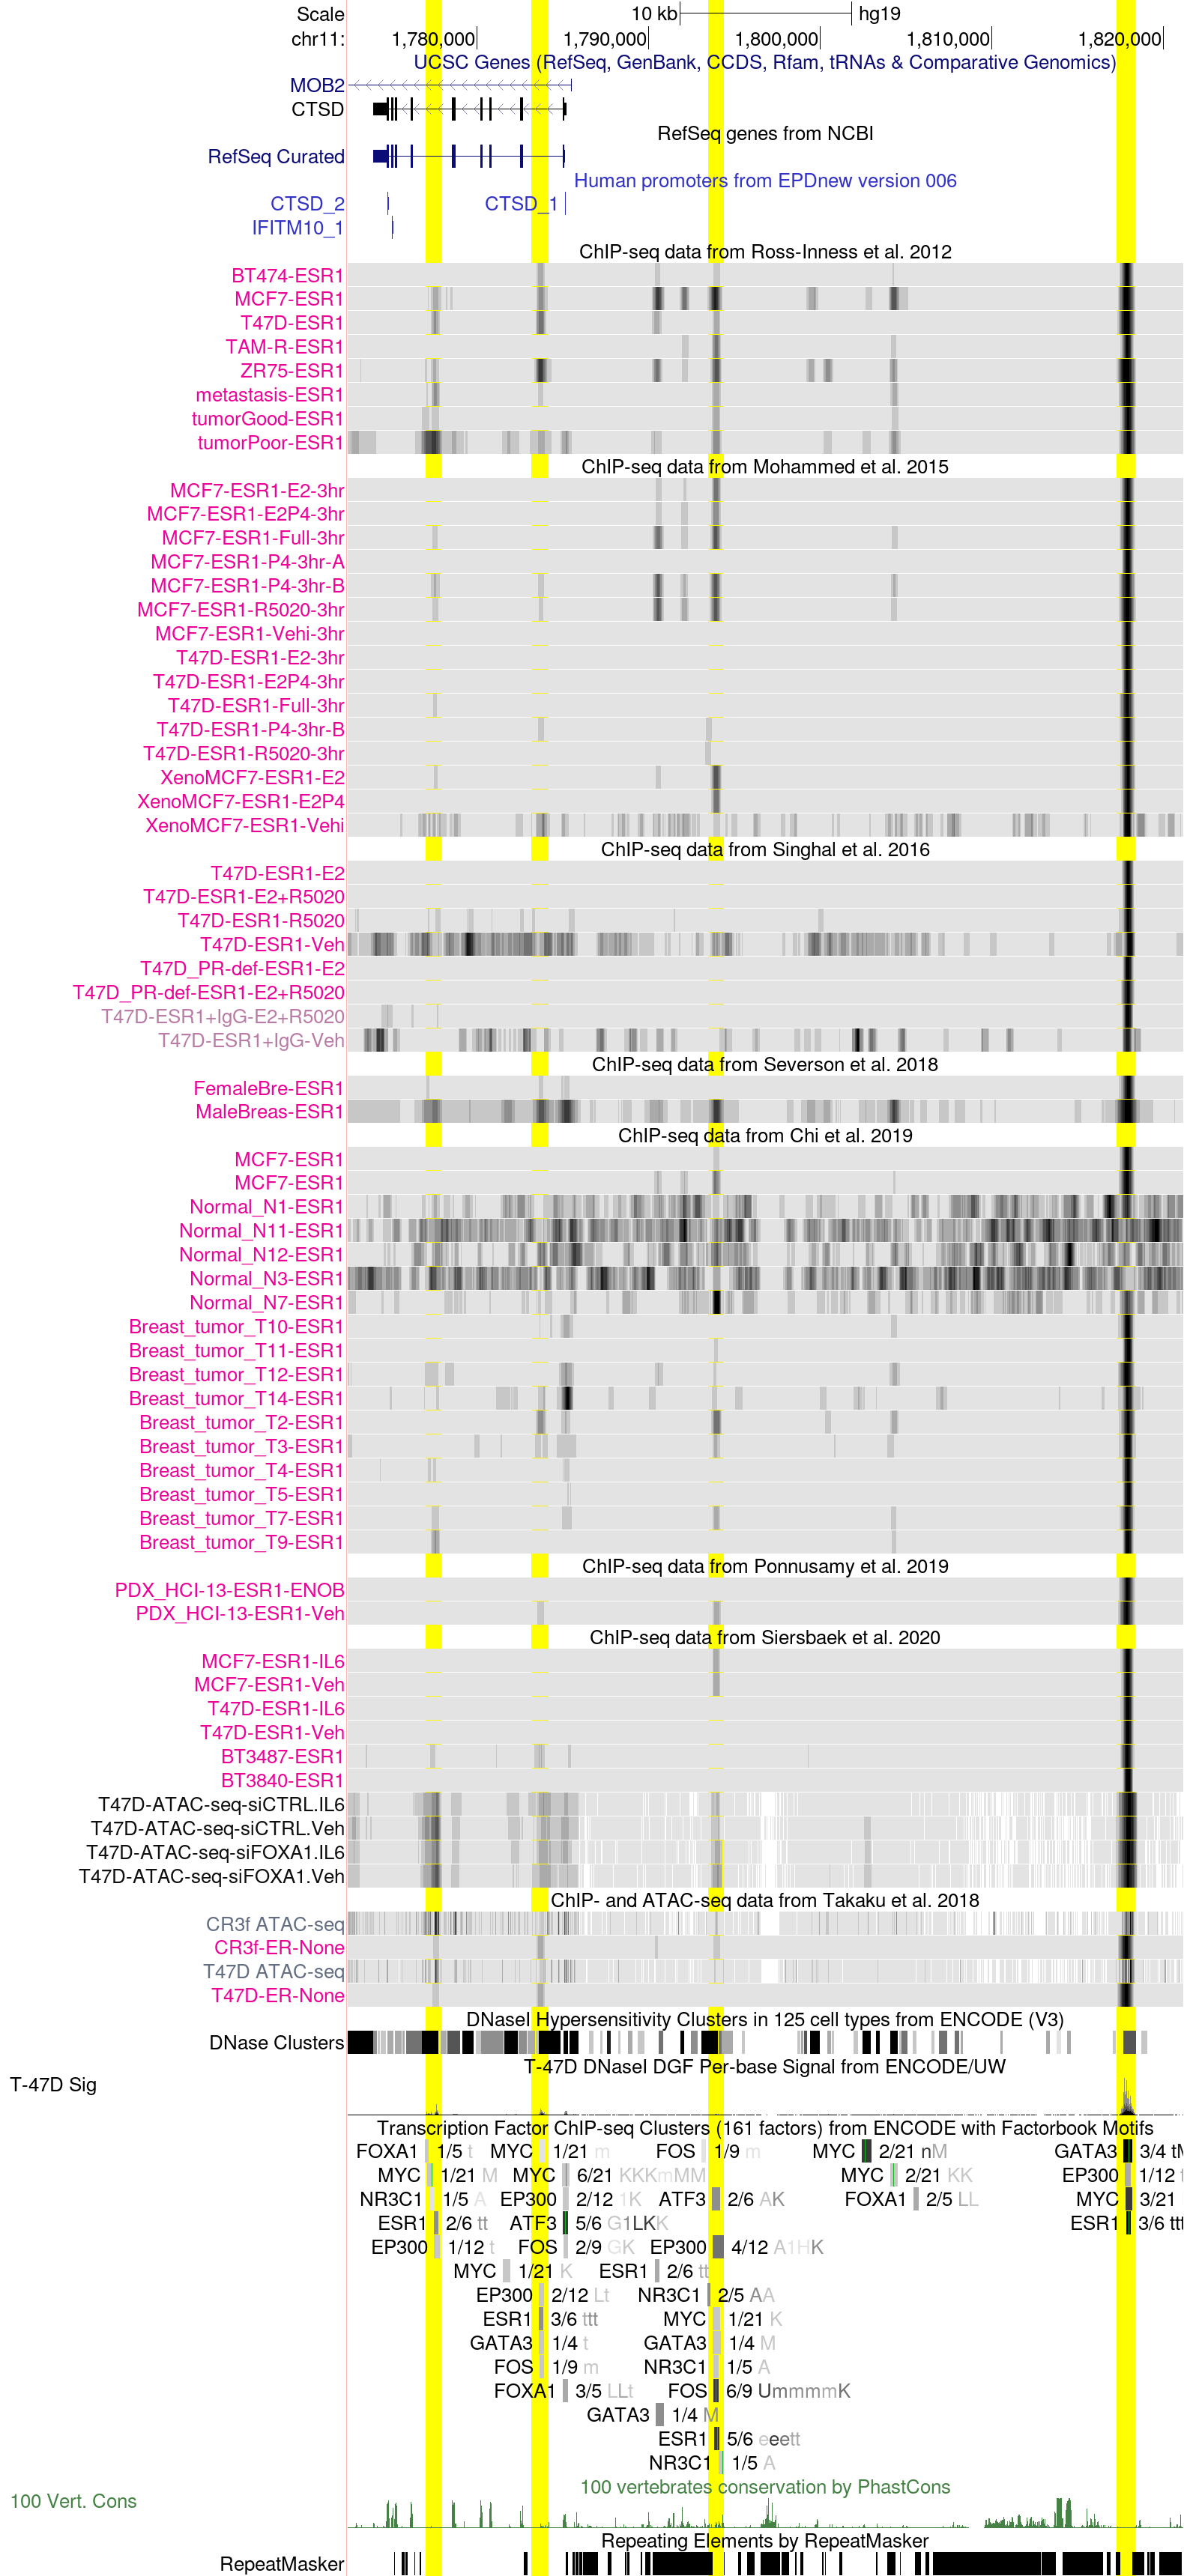
Cathepsin D (CTSD) is a lysosomal protease induced by estrogen in breast cancer cells (PMID:3527155, PMID:1633322) . High CTSD expression is associated with poor survival and metastases in breast cancer patients (PMID:229671, PMID:8948022). Indeed, it had been postulated that CTSD proteolytical activity favors the degradation of the basement membrane of the breast epithelium, allowing cells to become metastatic (PMID:1965795).
The above session displays, highlighted in yellow, estrogen receptor binding in four putative enhancer regions of CTSD. The first two regions of interest from the left are found in intronic regions within the CTSD gene locus, whereas the other two regions are located 9 and 33 kb upstream of the CTSD transcription start site, respectively. The distant enhancer region at 33 kb shows the highest degree of consistency across datasets (Ross-Innes et al., Mohammed et al., Singhal et al., Severson et al., Chi et al., Ponnusamy et al., Sierbaek et al., and Takaku et al.), with strong ER binding in most datasets (except for normal breast tissue). On the contrary, the first three regions display a more heterogeneous ER binding pattern across different sample types. Interestingly, while most breast cancer cell lines display strong ER signal at these genomic positions, normal breast specimens as well as most primary tumors appear not to be bound by ER in the proximity of the CTSD locus. Metastatic samples and cell lines in Ross-Inness et al. display strong ER binding. This might be explained by the origin of breast cancer cell lines, which are mostly derived from metastatic tumor samples.
Of note, in the Mohammed et al. dataset we can observe that while the first three highlighted regions are not bound by ER in hormone-deprived condition in both MCF7 and T47D cell lines, ER binding at the 33 kb distant enhancer is hormone-independent.
Furthermore, looking at the ENCODE ChIP-seq clusters set, we note that all four regions are bound by ER, but only the last two ones have an ER DNA binding motif, suggesting different recruitment mechanisms of ER. At regulatory sites void of DNA motif, ER might be recruited by pioneering transcription factors such as FOXA1 or GATA3. Additionally, ATAC-seq tracks from et al. and the ENCODE T-47D DNAse I Sig track indicate that all four regions display an open chromatin conformation, with stronger signal measured at the distant enhancer 33 kb upstream of the gene..
Overall, these data show that multiple ER docking sites might partake in CTSD regulation in a context-dependent fashion in breast cancer cells and tumors, possibly depending on both epigenetic remodeling and interactions of ER with multi-protein regulatory complexes.
Progesterone receptor (PGR) and androgen receptor (AR) binding at classical targets
KLK3 enhancer region in the hg19 Assembly
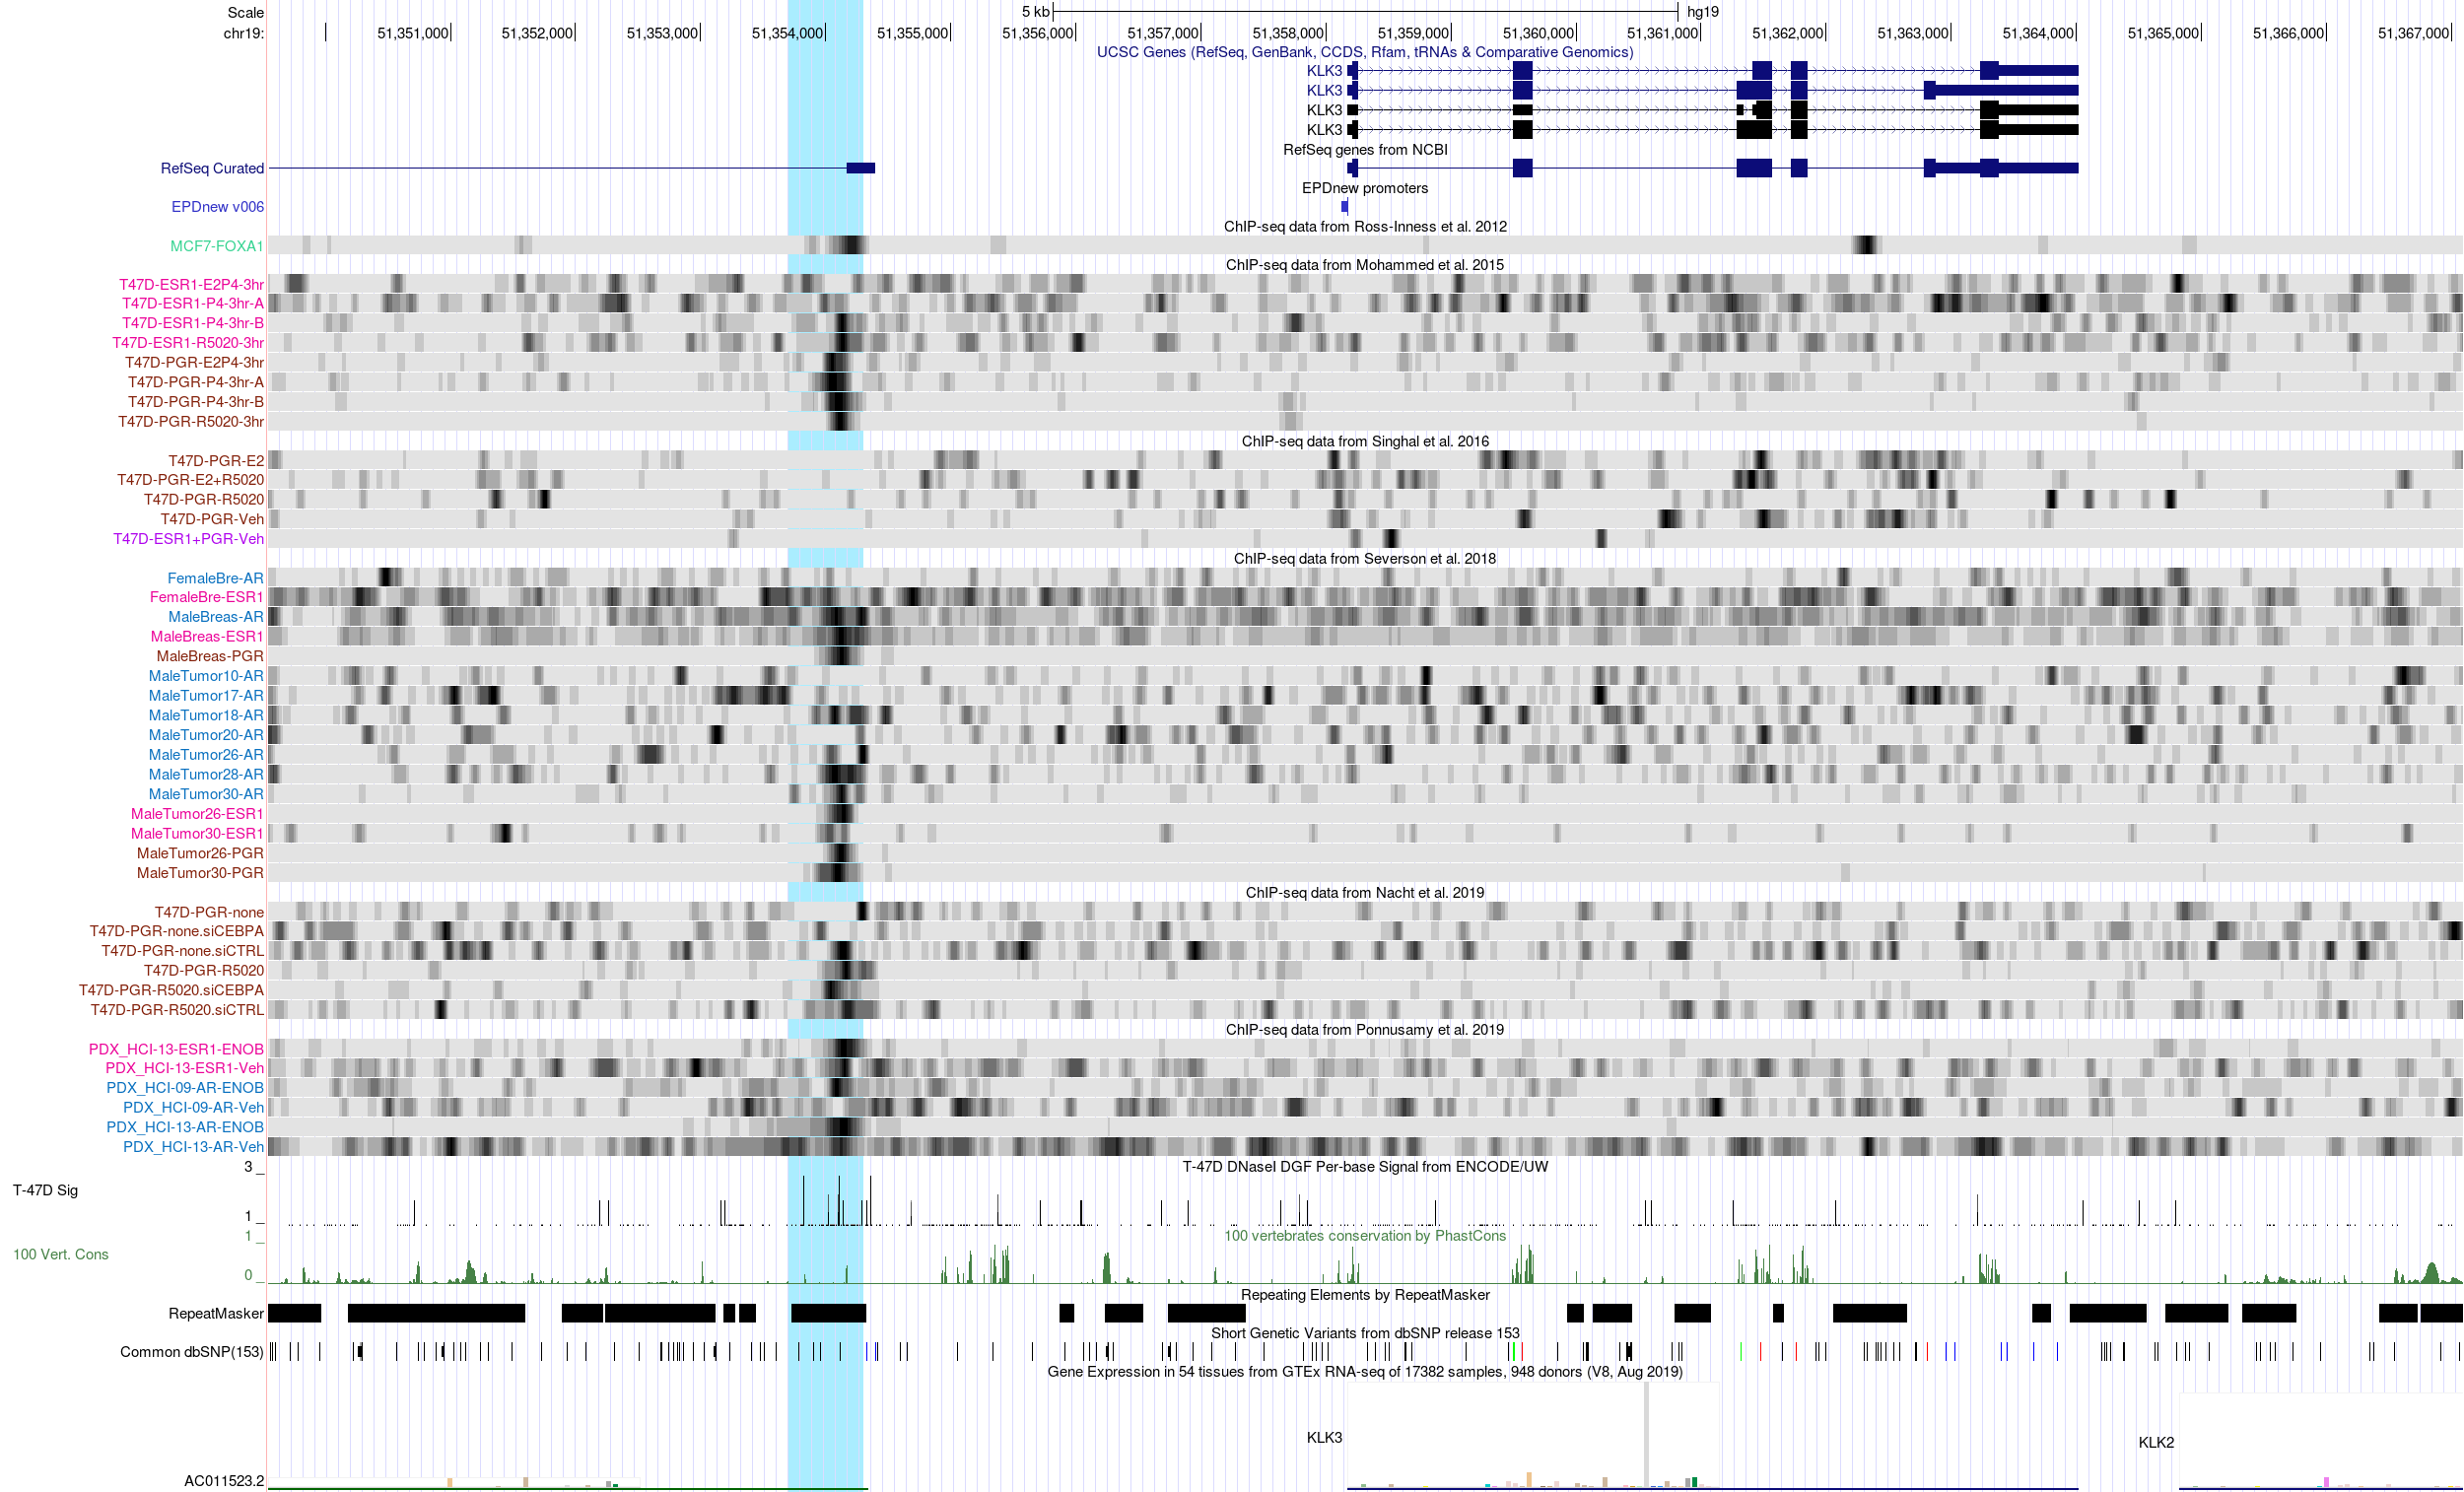
Kallikrein 3 (KLK3), better known as prostate-specific antigen or PSA, is a prototypic androgen (AR) target gene. It has been known for a long time that KLK3 is not only expressed in the prostate but also in the female breast. However, there is ongoing controversy on whether KLK3 expression in breast epithelial cells is induced by androgens, progestins or both (Sauter et al. 1998, PMID:9568787). One study implicates an androgen-responsive enhancer that evolved from an LTR40a element in the up-regulation of KLK3 in LNCaP prostate cancer cells (Lawrence et al. 2012, PMID:22597536). However, this finding doesn't rule out a role of progestins in KLK3 regulation in the female breast or breast tumors.
In the above browser screenshot, the afore-mentioned enhancer region is highlighted in light-blue. Interestingly, this enhancer region is bound by FOXA1 in MCF7 cells (Ross-Innes et al. track), suggesting that FOXA1 might act as a pioneer factor in opening the chromatin in this region. ChIP-seq data from Mohammed et al. show a clear PGR binding signal in both MCF7 and T47D cells, but strictly dependent in progestin treatment. Surprisingly, in male breast tumors (Severson et al. track), this region is primarily bound by PGR receptor. The AR ChIP-seq signal is rather noisy for most samples. ChIP-seq data-derived copy-number estimates (CNV track from Severson et al.) suggest amplification of the KLK3 locus in MCF7 cells, but not in patient-derived breast tumors. A female breast cancer xenograft (Ponnusamy et al. track) shows weak induction of AR binding upon androgen-stimulation.
ATAC-seq data from Klotz et al. look rather inconclusive. Overall, they indicate that the region is not accessible in circulating breast cancer tumor cells and derived mouse xenografts. However, the highlighted enhancer region overlaps with an open chromatin region shown in the ENCODE T-47D DNaseI Sigtrack. Double-clicking on the corresponding grey bar in the genome browser opens a new window telling us that this open chromatin region was detected in the prostate cancer cell line LNCaP independently of androgen stimulation. Finally, the RepeatMasker track at the bottom of the page confirms that the enhancer region indeed overlaps with an LTR element (symbolized by a light grey bar). The name of the element, LTR40a, is displayed in the genome browser upon mouse-over.
Overall, the track data shown for the KLK3 locus indicate that the highlighted LTR-derived enhancer is bound by progesterone receptor in breast cancer cells. Whether this binding event is causally involved in the activation of KLK3 expression remains, however, uncertain.
TNFSF11 (RANKL) enhancer region in the hg19 Assembly
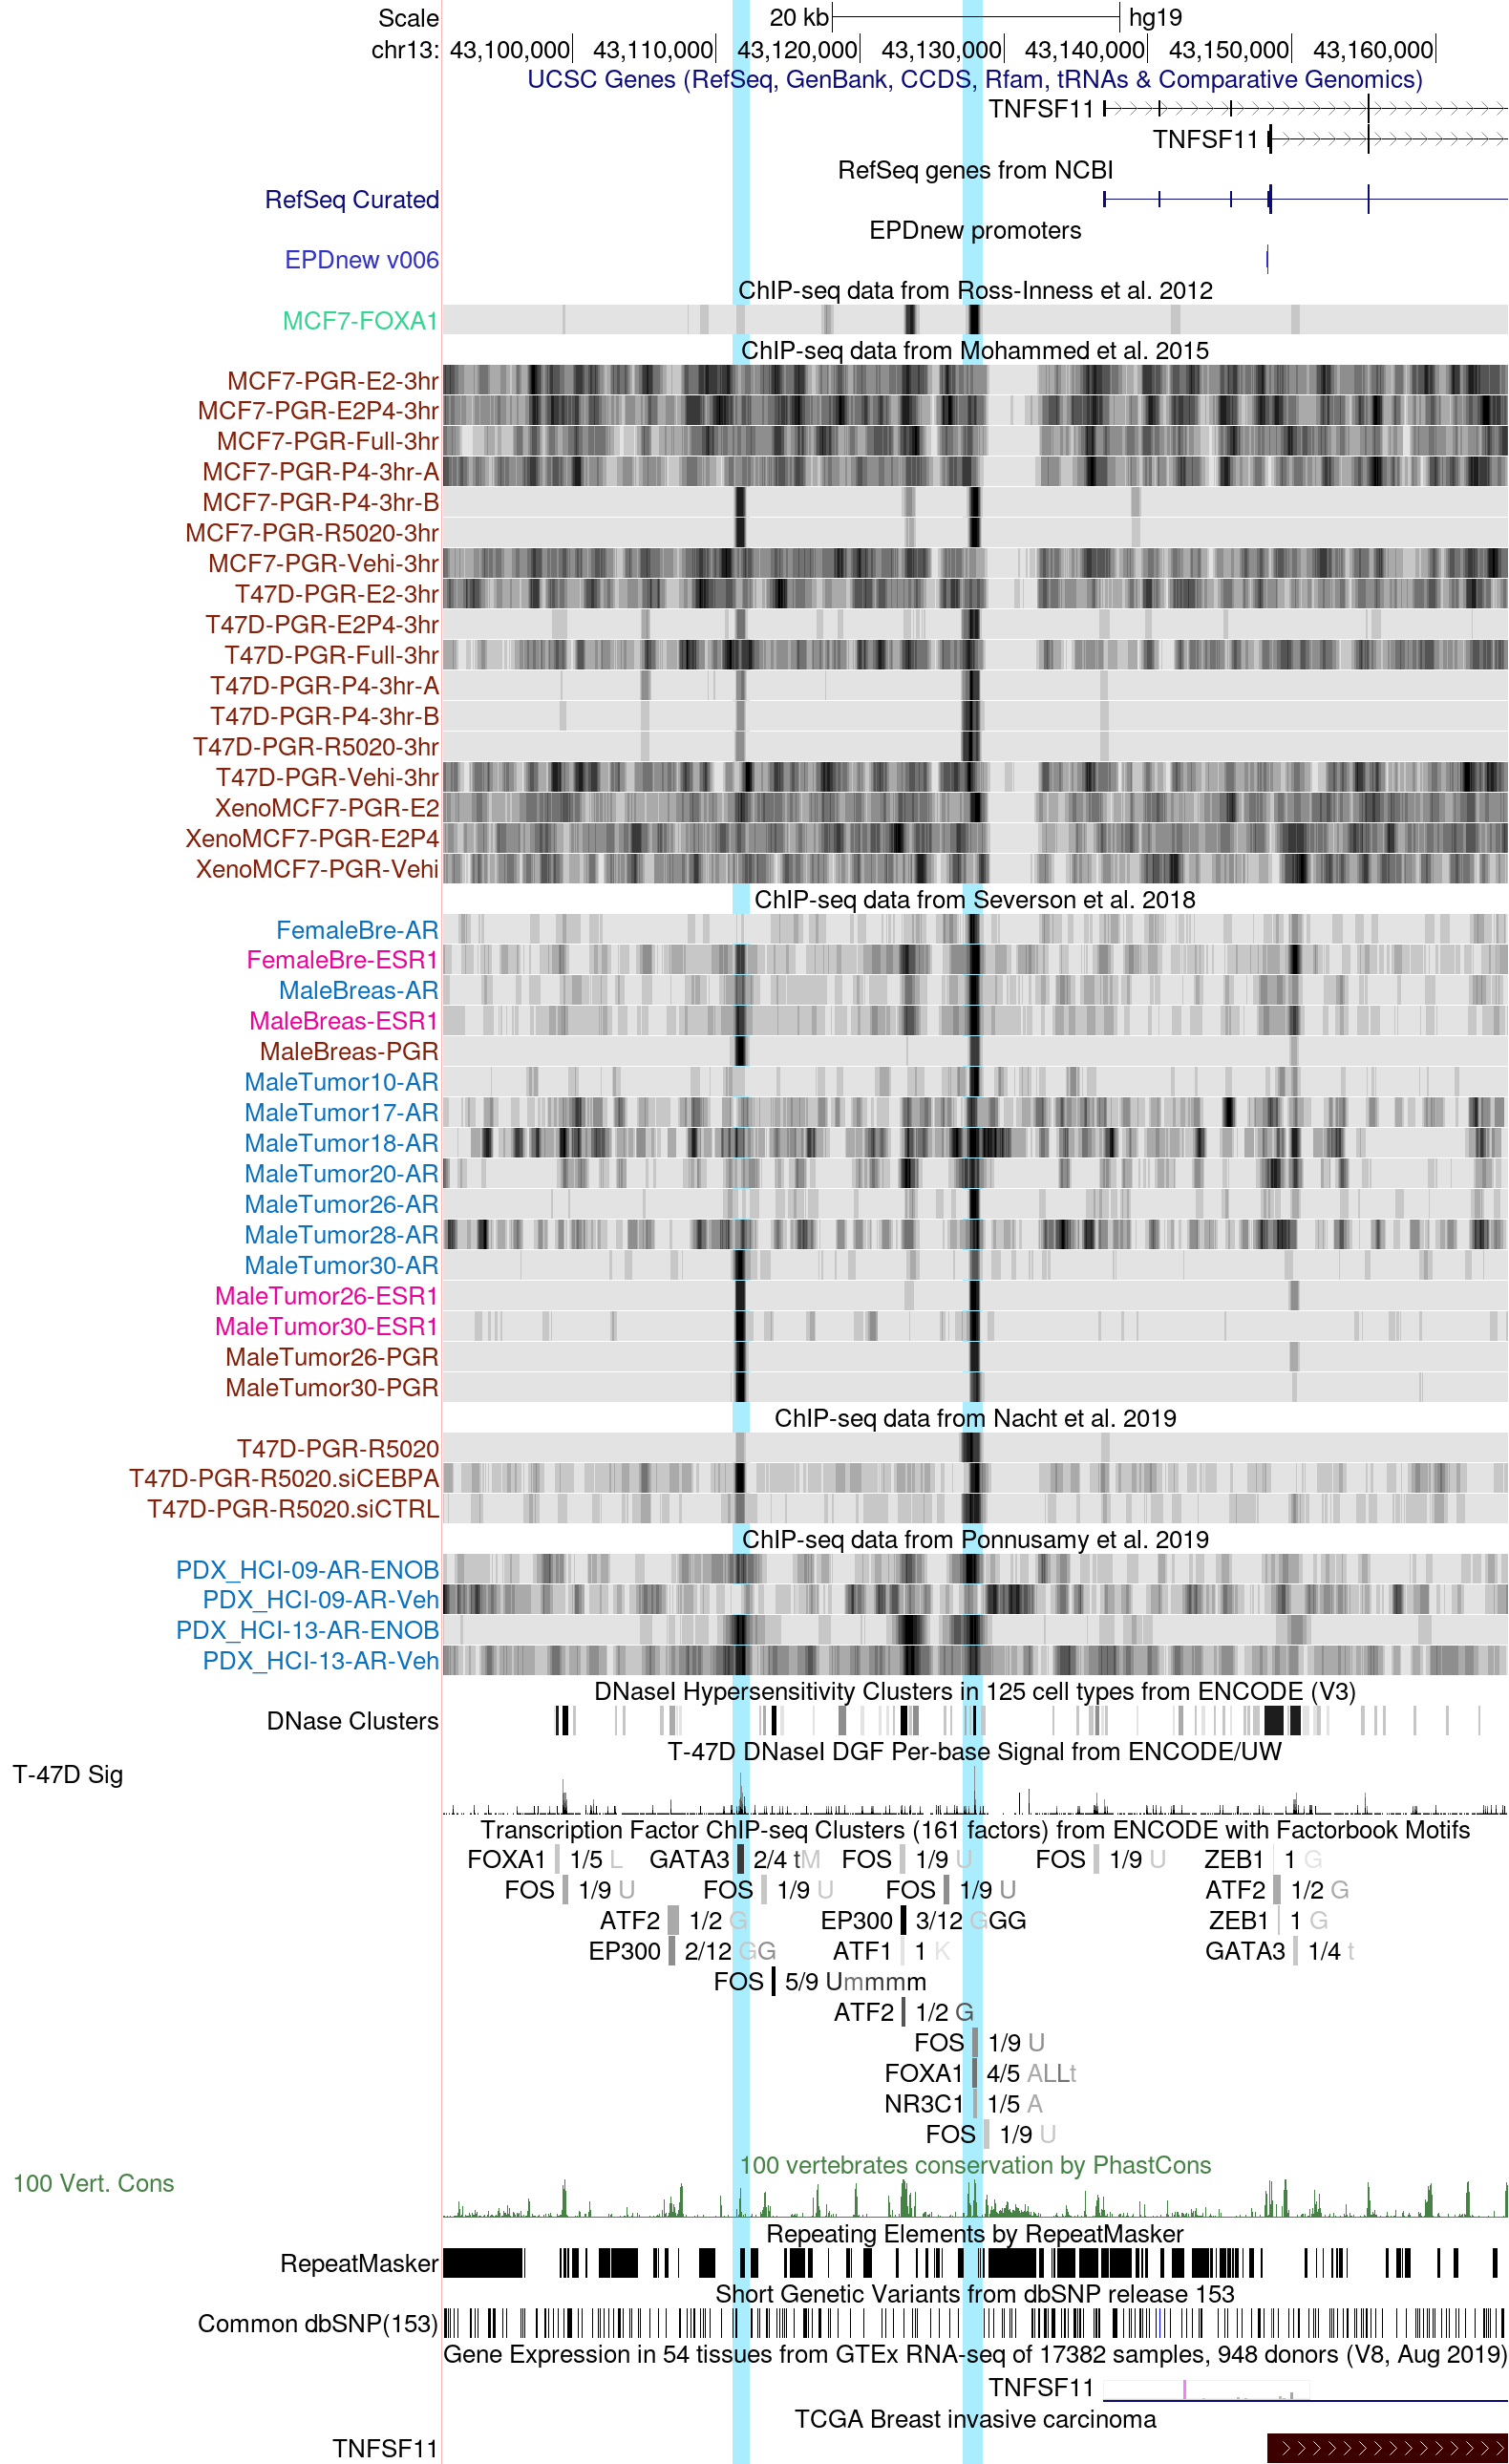
Tumor necrosis factor ligand superfamily member 11 (TNFSF11), also known as receptor activator of nuclear factor kappa-Β ligand (RANKL), is a paracrine effector of progesterone signaling that regulates cell proliferation of the human breast epithelium (Tanos et al. 2014, PMID: 23616122). Binding of RANKL to its cognate receptor RANK activates transcription factors such as NF-kB, promoting stem cell-like properties in the human breast (Joshi et al. 2010, PMID: 20445538; Asselin-Labat et al. 2010, PMID: 20383121). While it has being shown that progesterone receptor activation leads to RANKL mRNA stabilization, its transcriptional regulation is not yet fully defined (Tanos et al. 2014, PMID: 23616122).
The session displayed above highlights two putative enhancer regions approximately 25 and 9 kb upstream of RANKL transcription start site (TSS), respectively. Both regions display PR binding across different datasets including breast cancer cell lines, breast cancer clinical specimen as well as cell-derived and patient-derived xenografts.
The binding of PR appears to be dependent on hormone, since the PR peaks are absent in breast cancer cell lines in unstimulated conditions but become visible in the presence of natural progesterone (P4) or the synthetic PR agonist R5020 (Mohammed et al. track).
Interestingly, the two regions display binding of AR in several datasets of breast cancer clinical specimen and patient-derived xenografts, implying a possible crass-talk between PR and AR at these genomic regions (Severson et al., and Ponnusamy et al. tracks). The more proximal region 9kb upstream of TNFSF11 shows more consistent AR binding compared to the more distal region at 25 kb. Like PR, AR binding appears to be dependent on the presence of its cognate hormone dihydrotestosterone (DHT) or the synthetic AR agonist Enobosarm (Ponnusamy et al. track).
The ENCODE track at the bottom of the page displays additional transcription factors detected at the two enhancer regions. The pioneer factor GATA3 is present in the more distant region, while the proximal enhancer 9 kb upstream of RANKL gene is co-bound by FOXA1. The binding of FOXA1 is also confirmed in the ChIP-seq tracks displayed above, across different datasets (Ross-Innes et al., Ponnusamy et al., and Sierbaek et al. tracks). The presence of these two pioneer factors may be required for chromatin opening prior to PR and/or AR binding at these regions, or for direct tethering by protein-protein interaction.
We can also observe that both regions appear to be in a "open chromatin" state both in the T47D DNaseI footprinting track as well as in the ATAC-seq datasets (Sierbaek et al. track), suggesting a possible functional role for these loci. To further corroborate this hypothesis, both regions appear to be highly conserved across vertebrates, as displayed in the region conservation track.
STAT3 binding and CAGE data reflect the activity of an enhancer of the AIM2 gene
AIM2 enhancer element in the hg19 Assembly
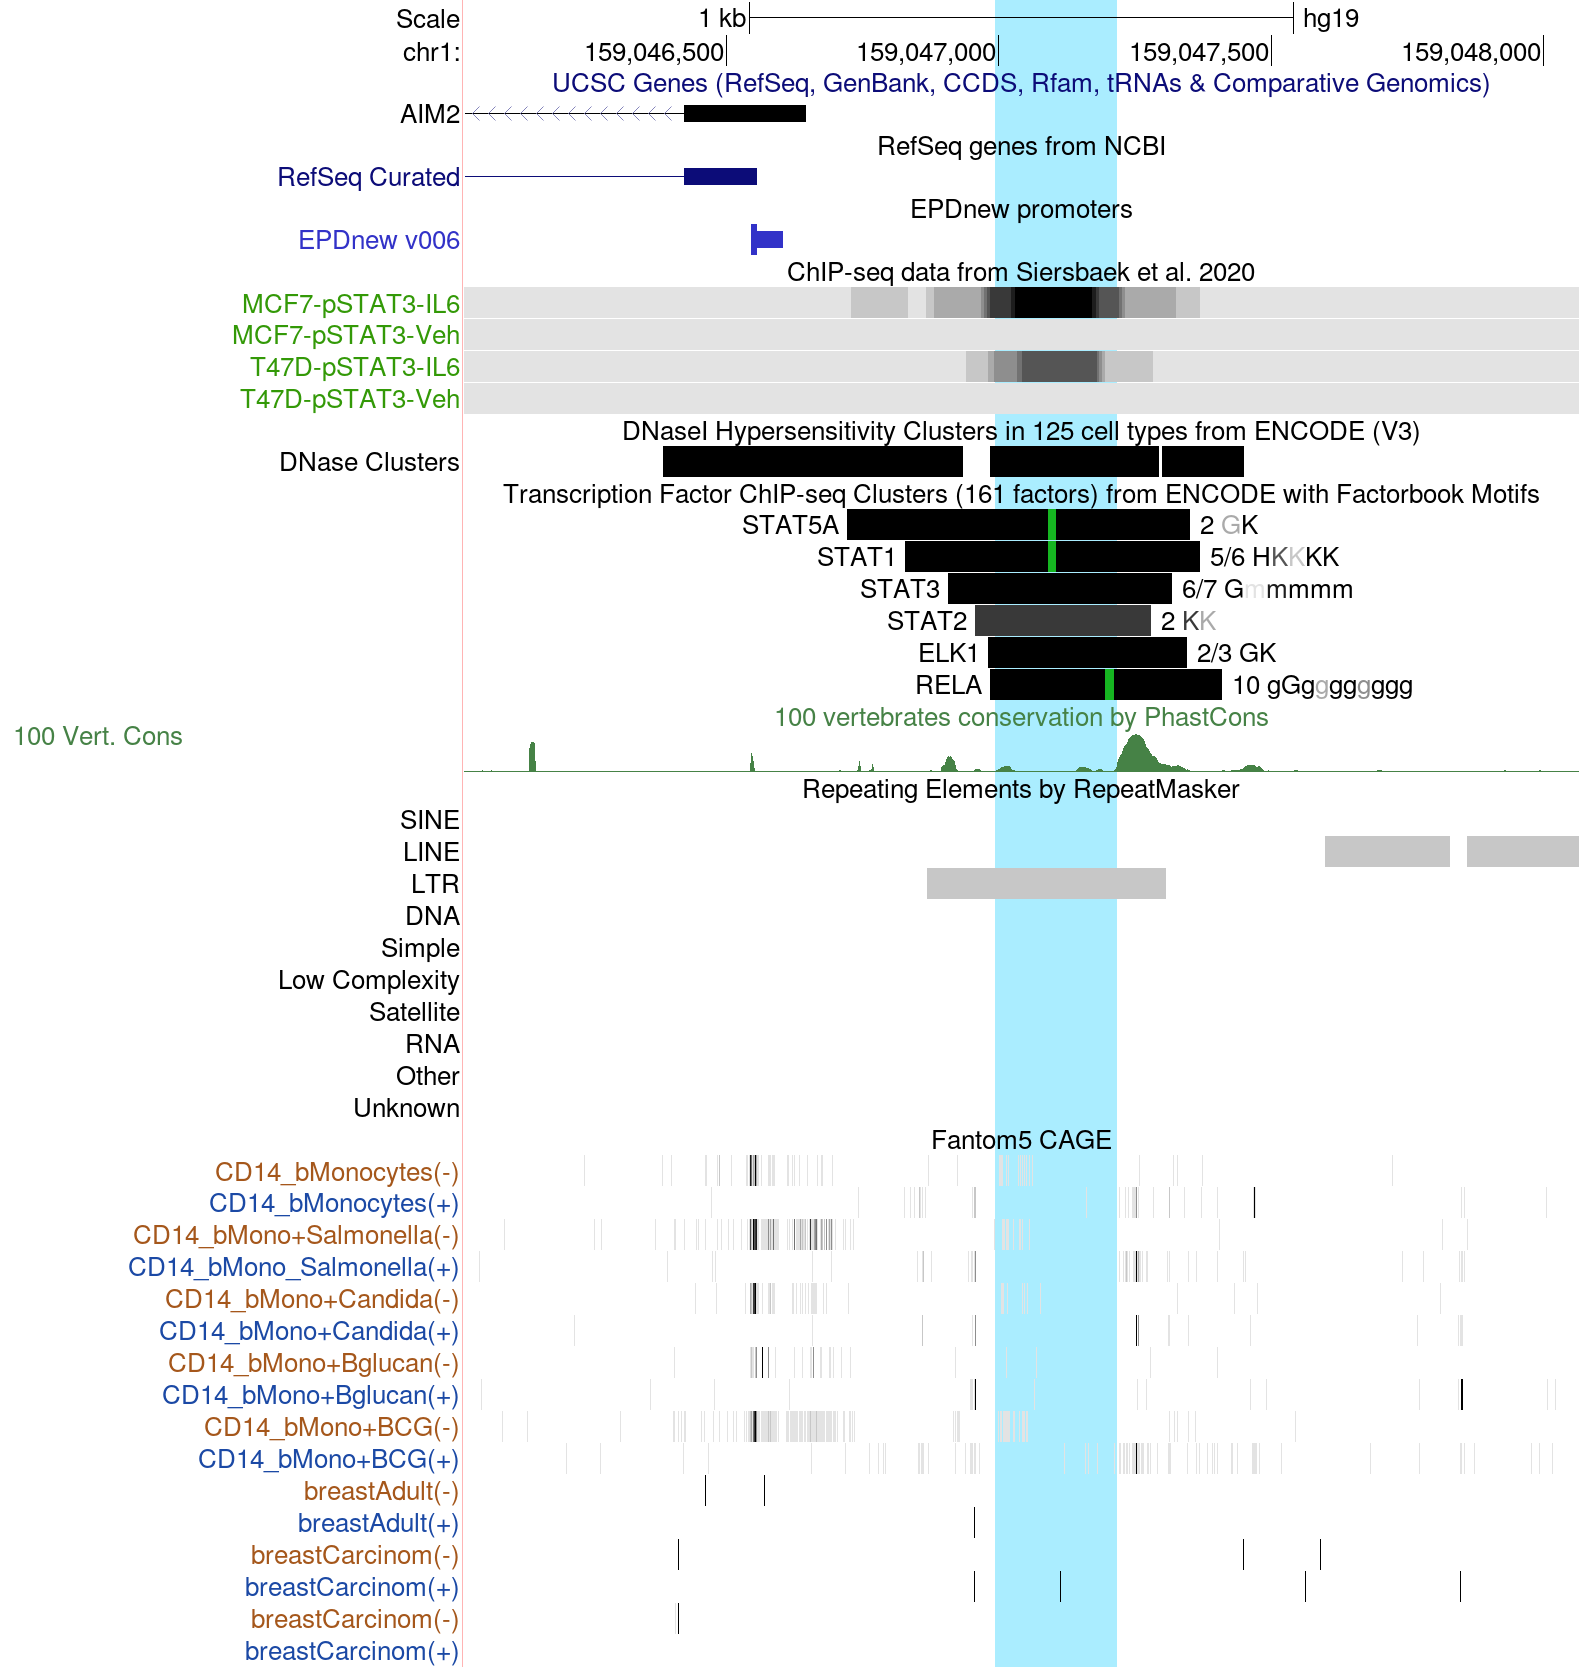
The AIM2 protein, a component of the inflammosome, reportedly suppresses cell proliferation and tumor growth in breast cancer (Chen et al., 2006). Expression of the AIM2 gene is regulated by an exapted (recycled for a new function) retroelement of the MER41 family, which contains two adjacent STAT1 binding motifs (Schmid and Bucher, 2010). These binding sites render the gene γ-interferon inducible via the JAK-STAT pathway (Chuong et al., 2016). In gastrointestinal cancers, up-regulation of AIM2 is mediated by cytokine-induced phosphorylated STAT3 (pSTAT3) (Dawson et al., 2021).
ChIP-seq data for pSTA3 have recently become available for breast cancer cell lines treated with IL6 (Sierbaek et al., 2020). Since STAT1 and STAT3 recognize similar DNA motifs, one could speculate that the aforementioned MER41 element is capable of inducing AIM2 in breast cancer via pSTAT3.
The browser screenshot shown here is centered on the MER41 element marked by a black bar in the RepeatMasker track. The ENCODE ChIP-seq cluster track indicates binding peaks for several STAT family members plus ELK1 and RELA. Highlighted in green are STAT and NF-kB (RELA) DNA binding motifs. The ChIP-seq tracks from Siersbaek et al. show that this enhancer region is bound by pSTAT3 upon IL6 stimulation in two breast cancer cell lines, MCF7 and T47D.
The lower part of the image shows CAGE tracks from the EPD viewer hub, reflecting transcription initiation events. Since the MER41 element under investigation is a transcriptionally active enhancer, such data can reveal its activity status across different tissues. We note transcriptional activity in the antisense direction in CD14 blood monocytes under some conditions, in particular upon stimulation with BCG (tuberculosis) live vaccine. Conversely, in unstimulated normal and cancerous breast tissue, this enhancer appears to be silent, consistent with the pSTAT3 ChIP-seq data for breast cancer cell lines.
Taken together, these observations suggest that AIM2 is silent in breast cancer cells under unstimulated conditions but induced by IL6 via pSTAT3 binding to the MER41 element.
